Below I have listed a selected limited set of my publications and some presentations I’ve given.
For a complete list of my papers see the ADS
Selected Publications
Technical
Published
I have an invited review chapter in 2015 edition of Annual Reviews of Astronomy & Astrophysics on “Interstellar Dust Grain Alignment” by Andersson, Lazarian & Vaillancourt (sorry, can’t post full .pdf file)
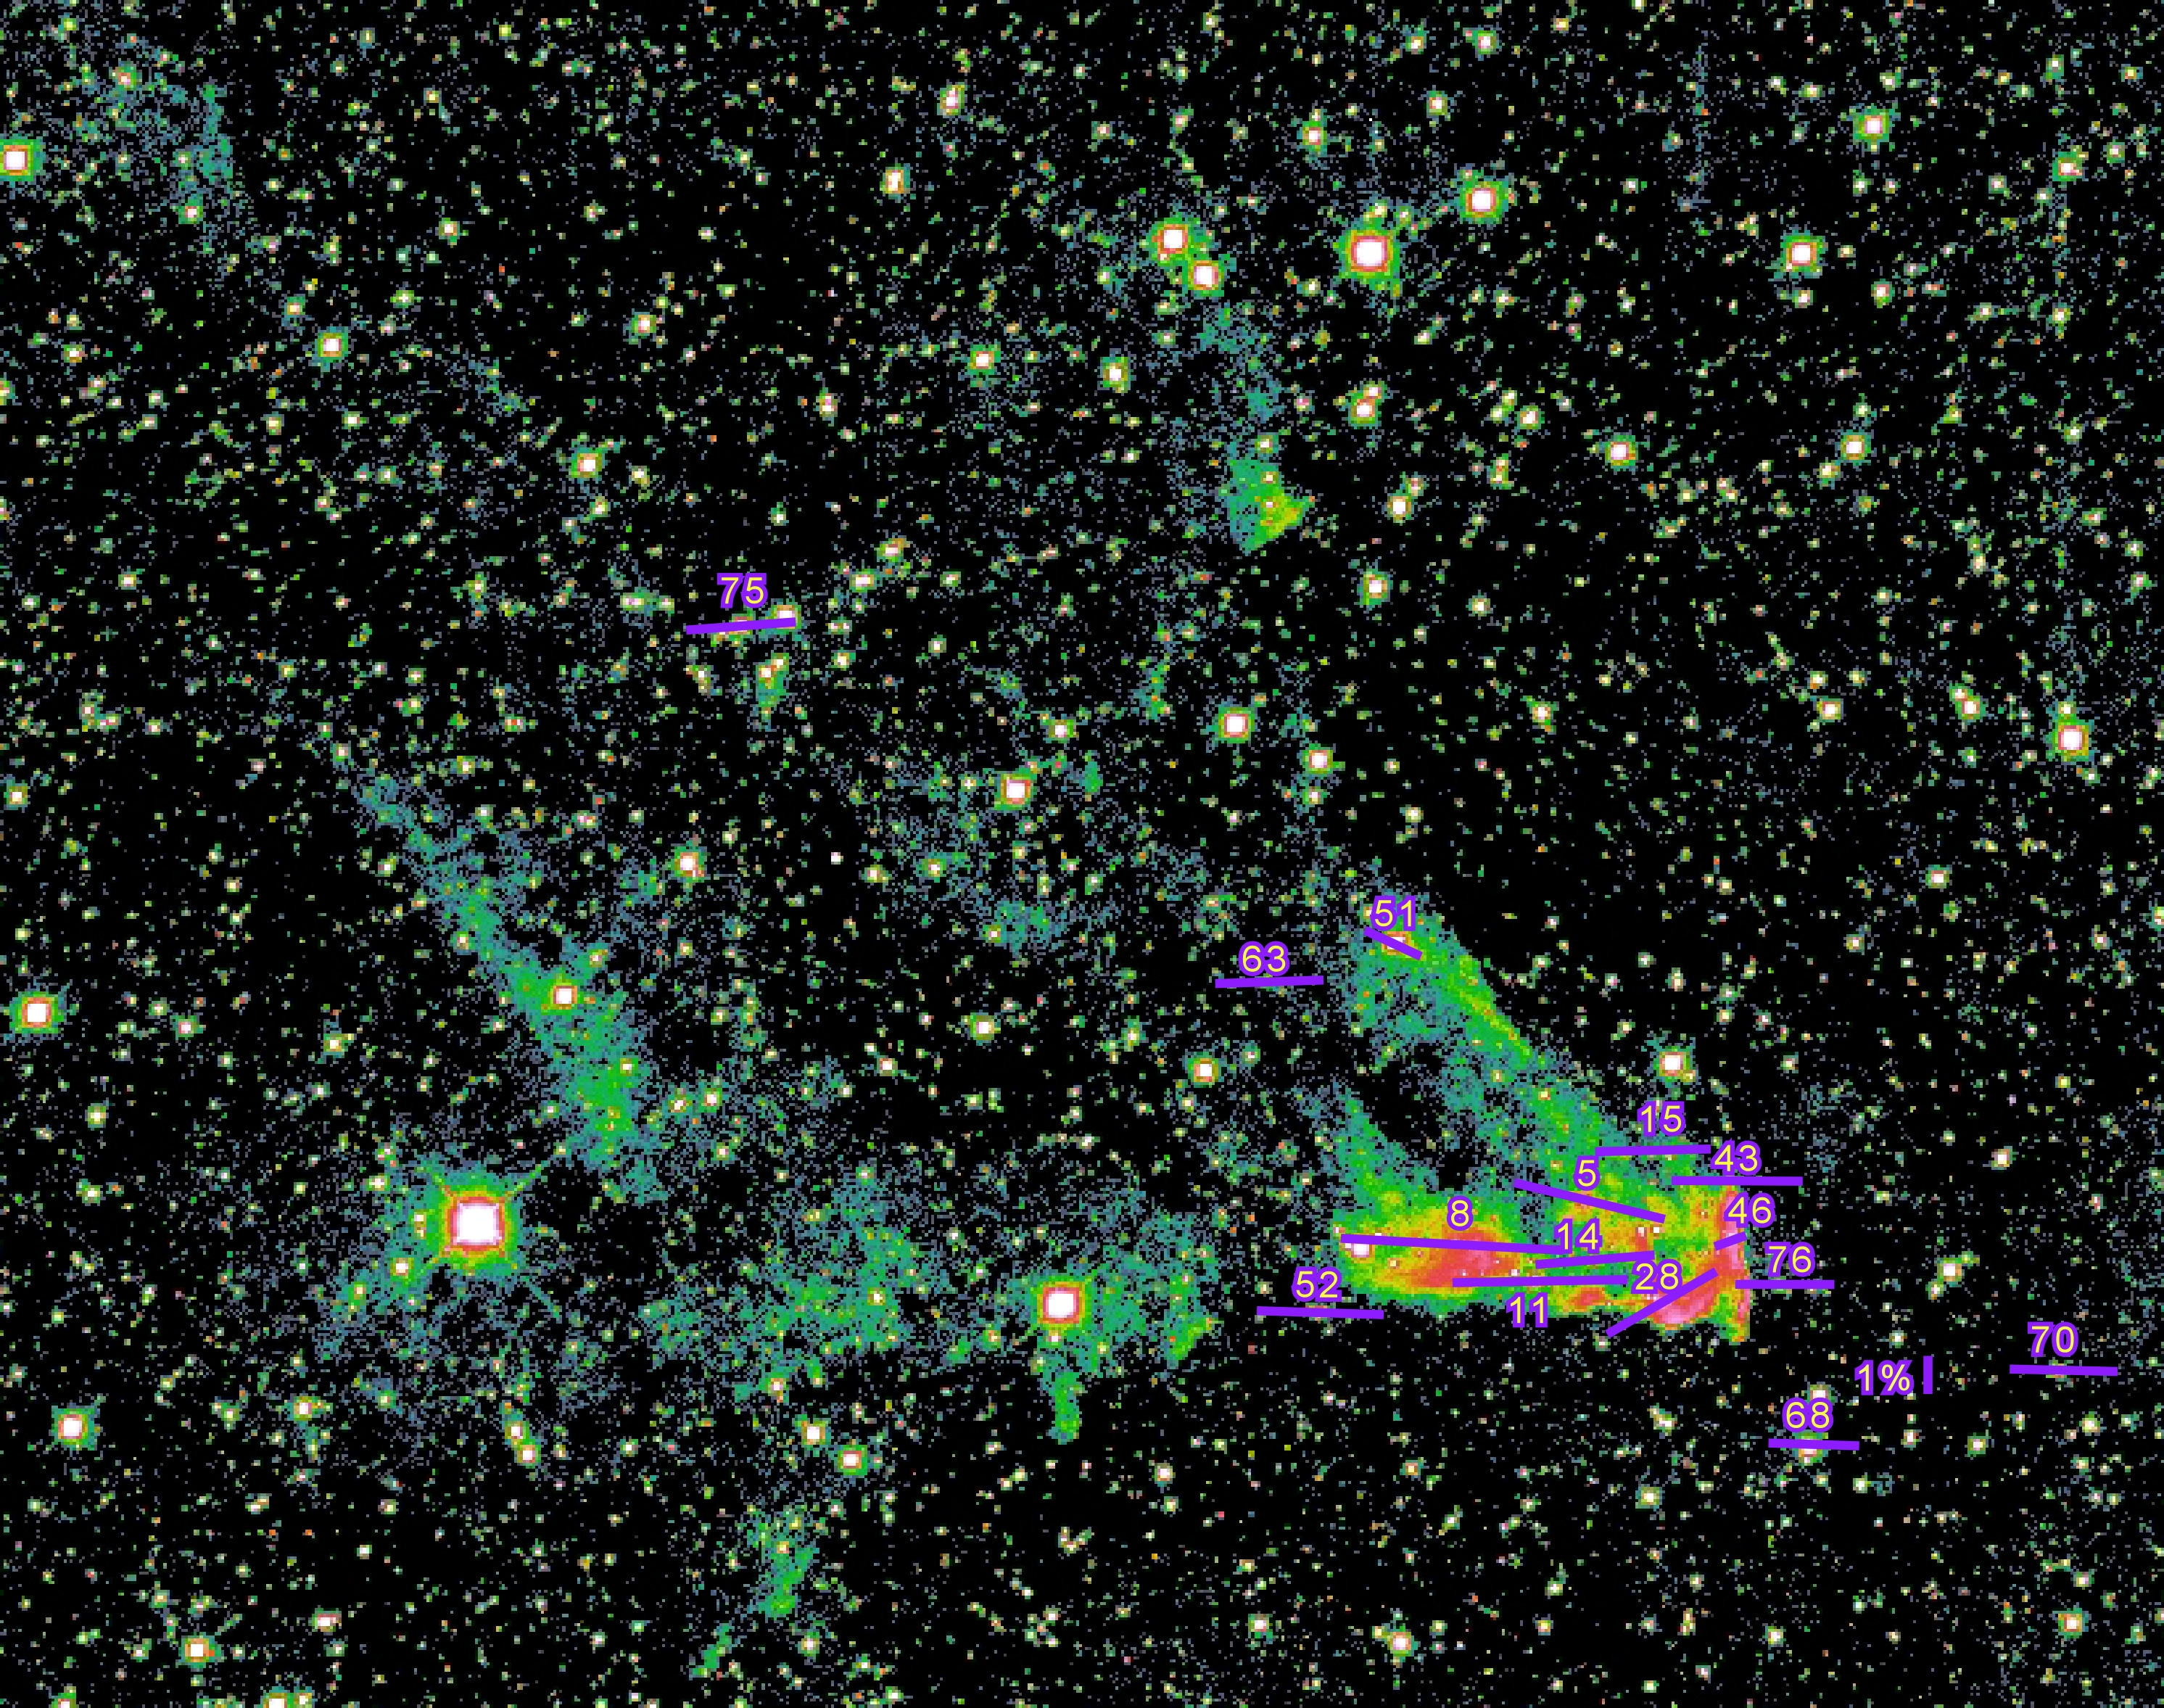
Here’s the paper reporting the discovery of H2 enhanced grain alignment in the reflection nebula and photo-dissociation region IC 63 (Andersson et al., 2013, ApJ, 775, 84; see the figure above)
And the associated “press release”
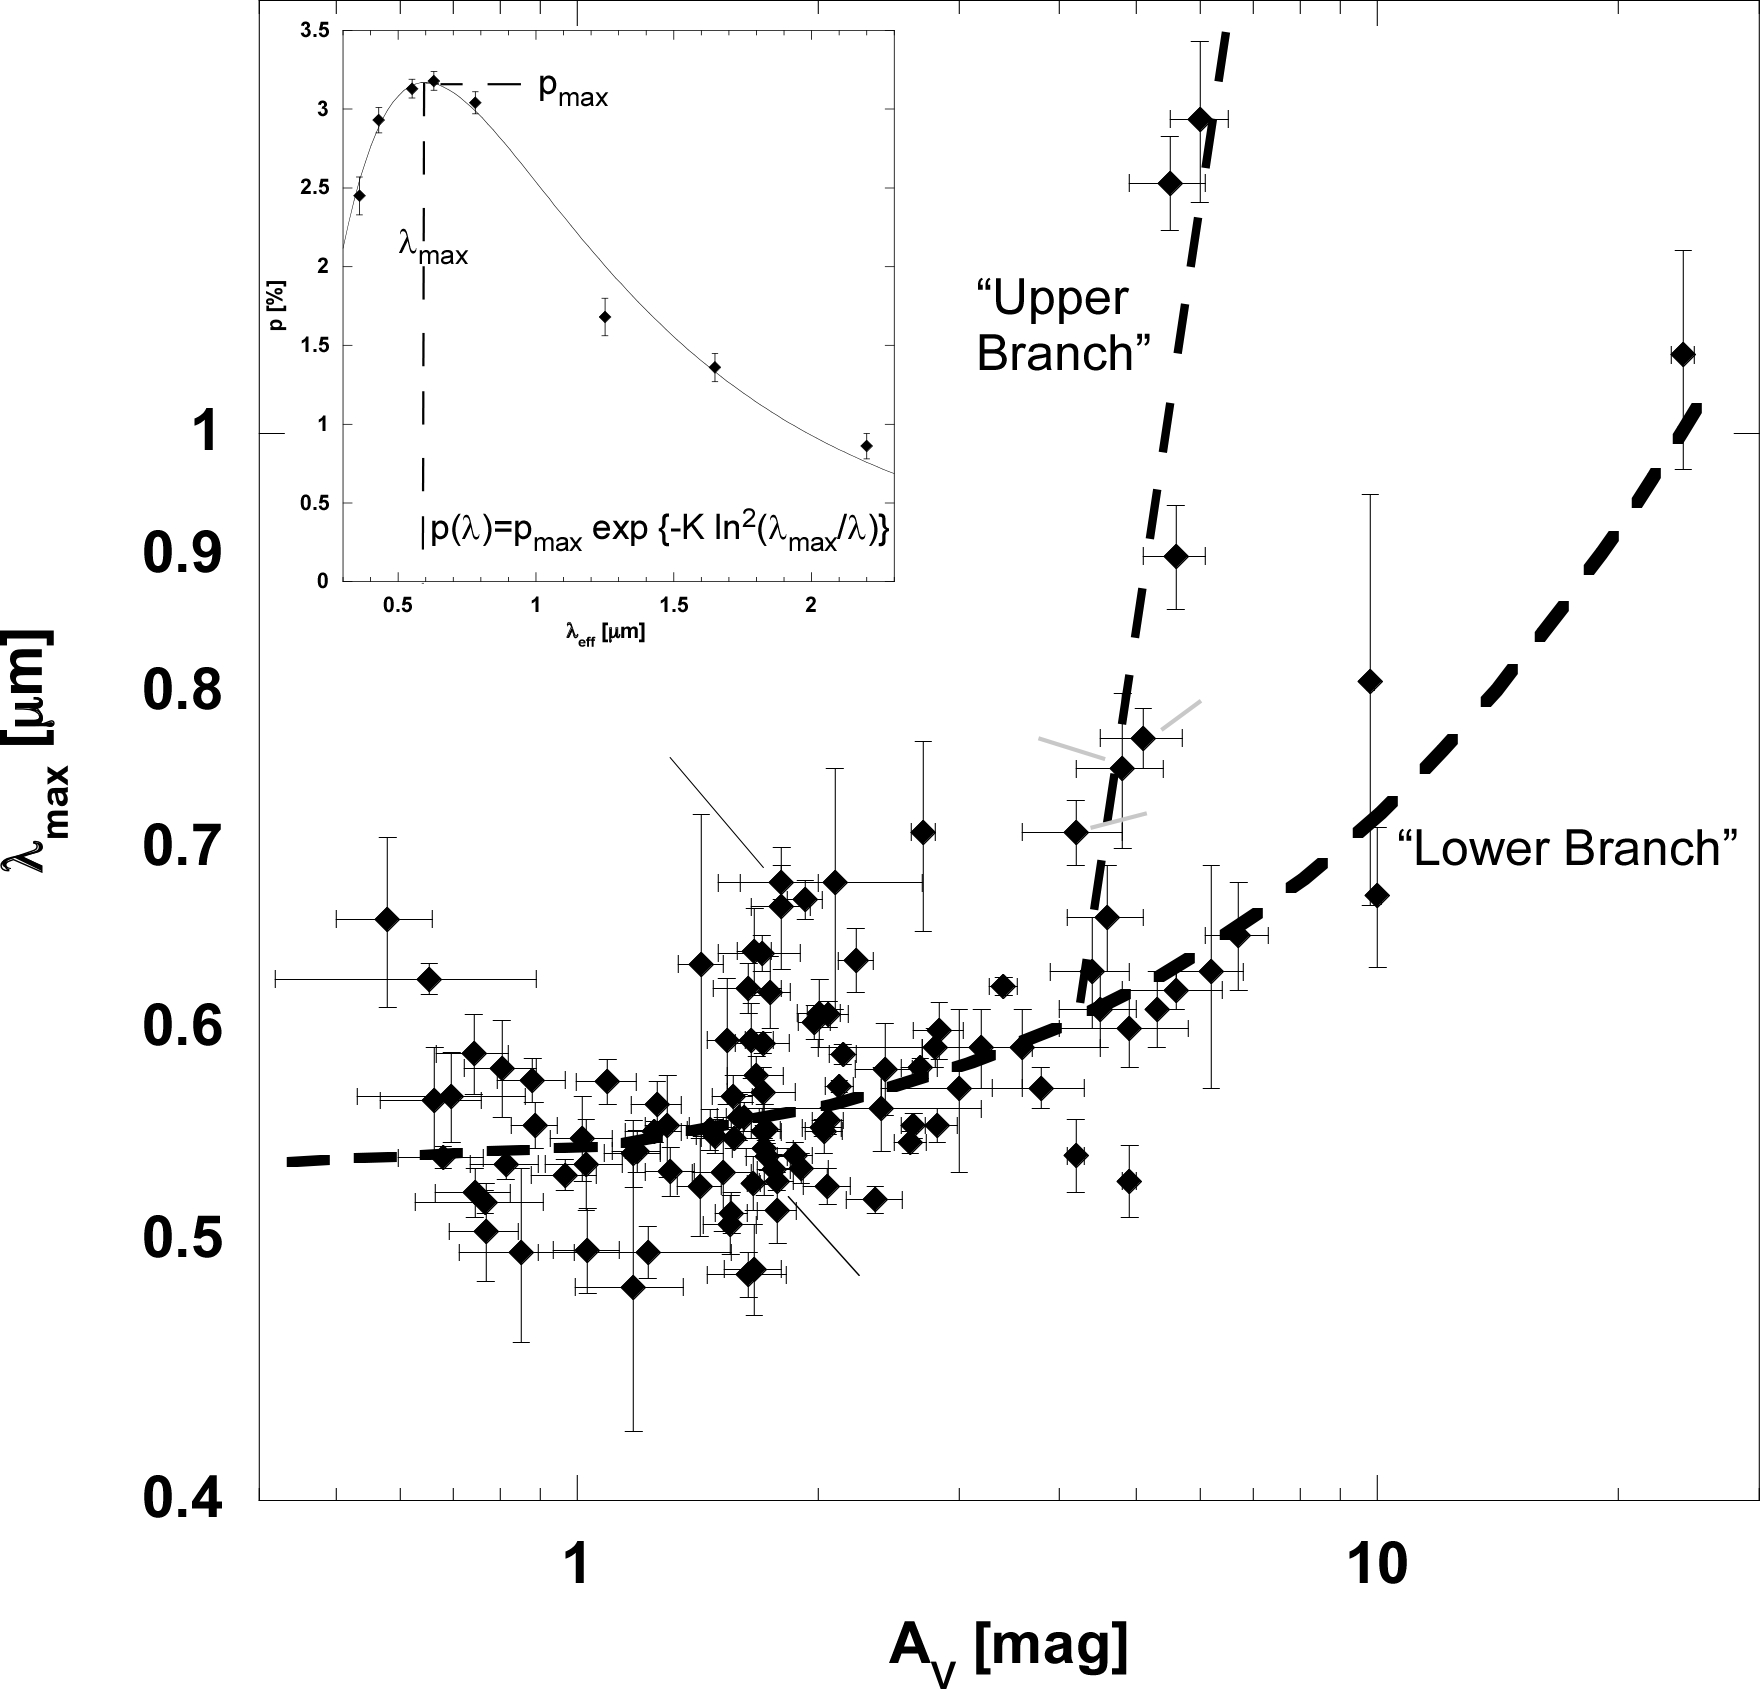
In my first consequential paper on the issue of grain alignment, Steve Potter and I (Andersson & Potter 2007), elaborated on a suggestion by Whittet et al. 2001 and showed that the location of the peak of the visual polarization is universally linearly correlated with the extinction, showing that the color of the light affects which grains are aligned.
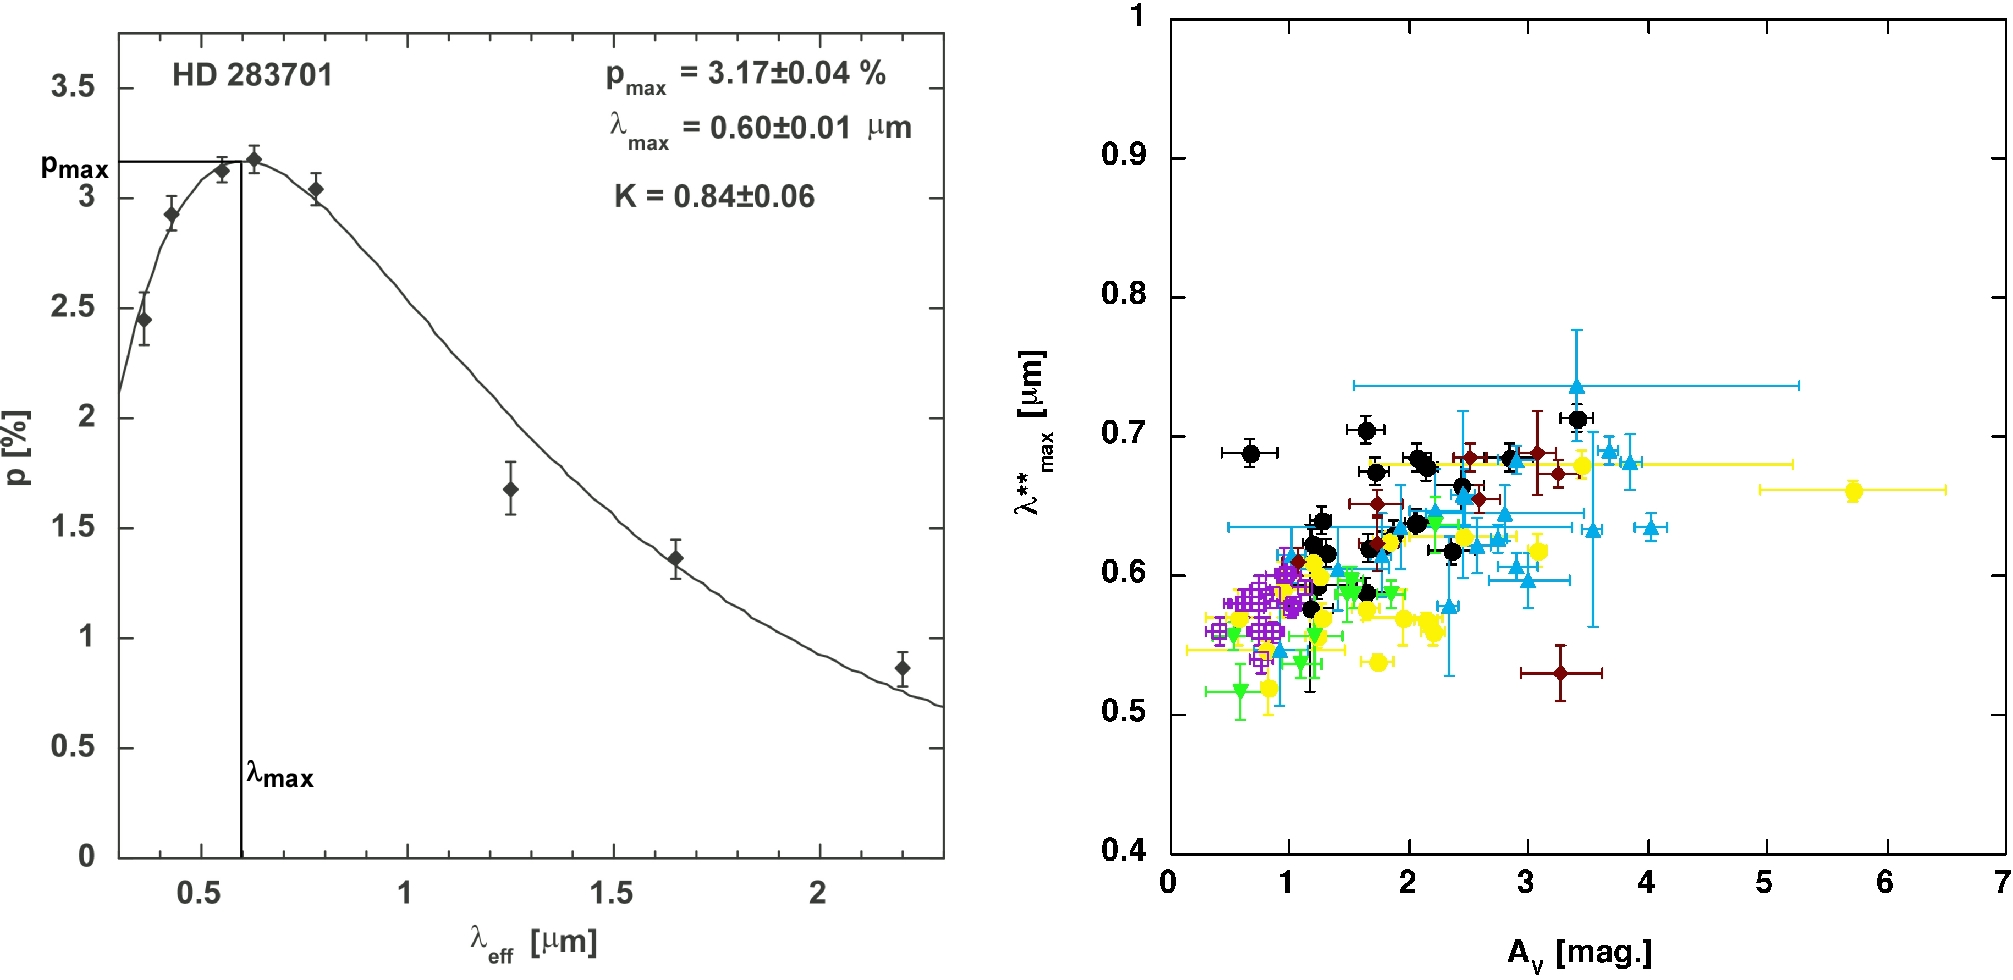
In our 2007 paper we showed that λmax is universally related to the visual extinction of the material meaning that the alignment of the dust grains is related to the color of the illuminating light.
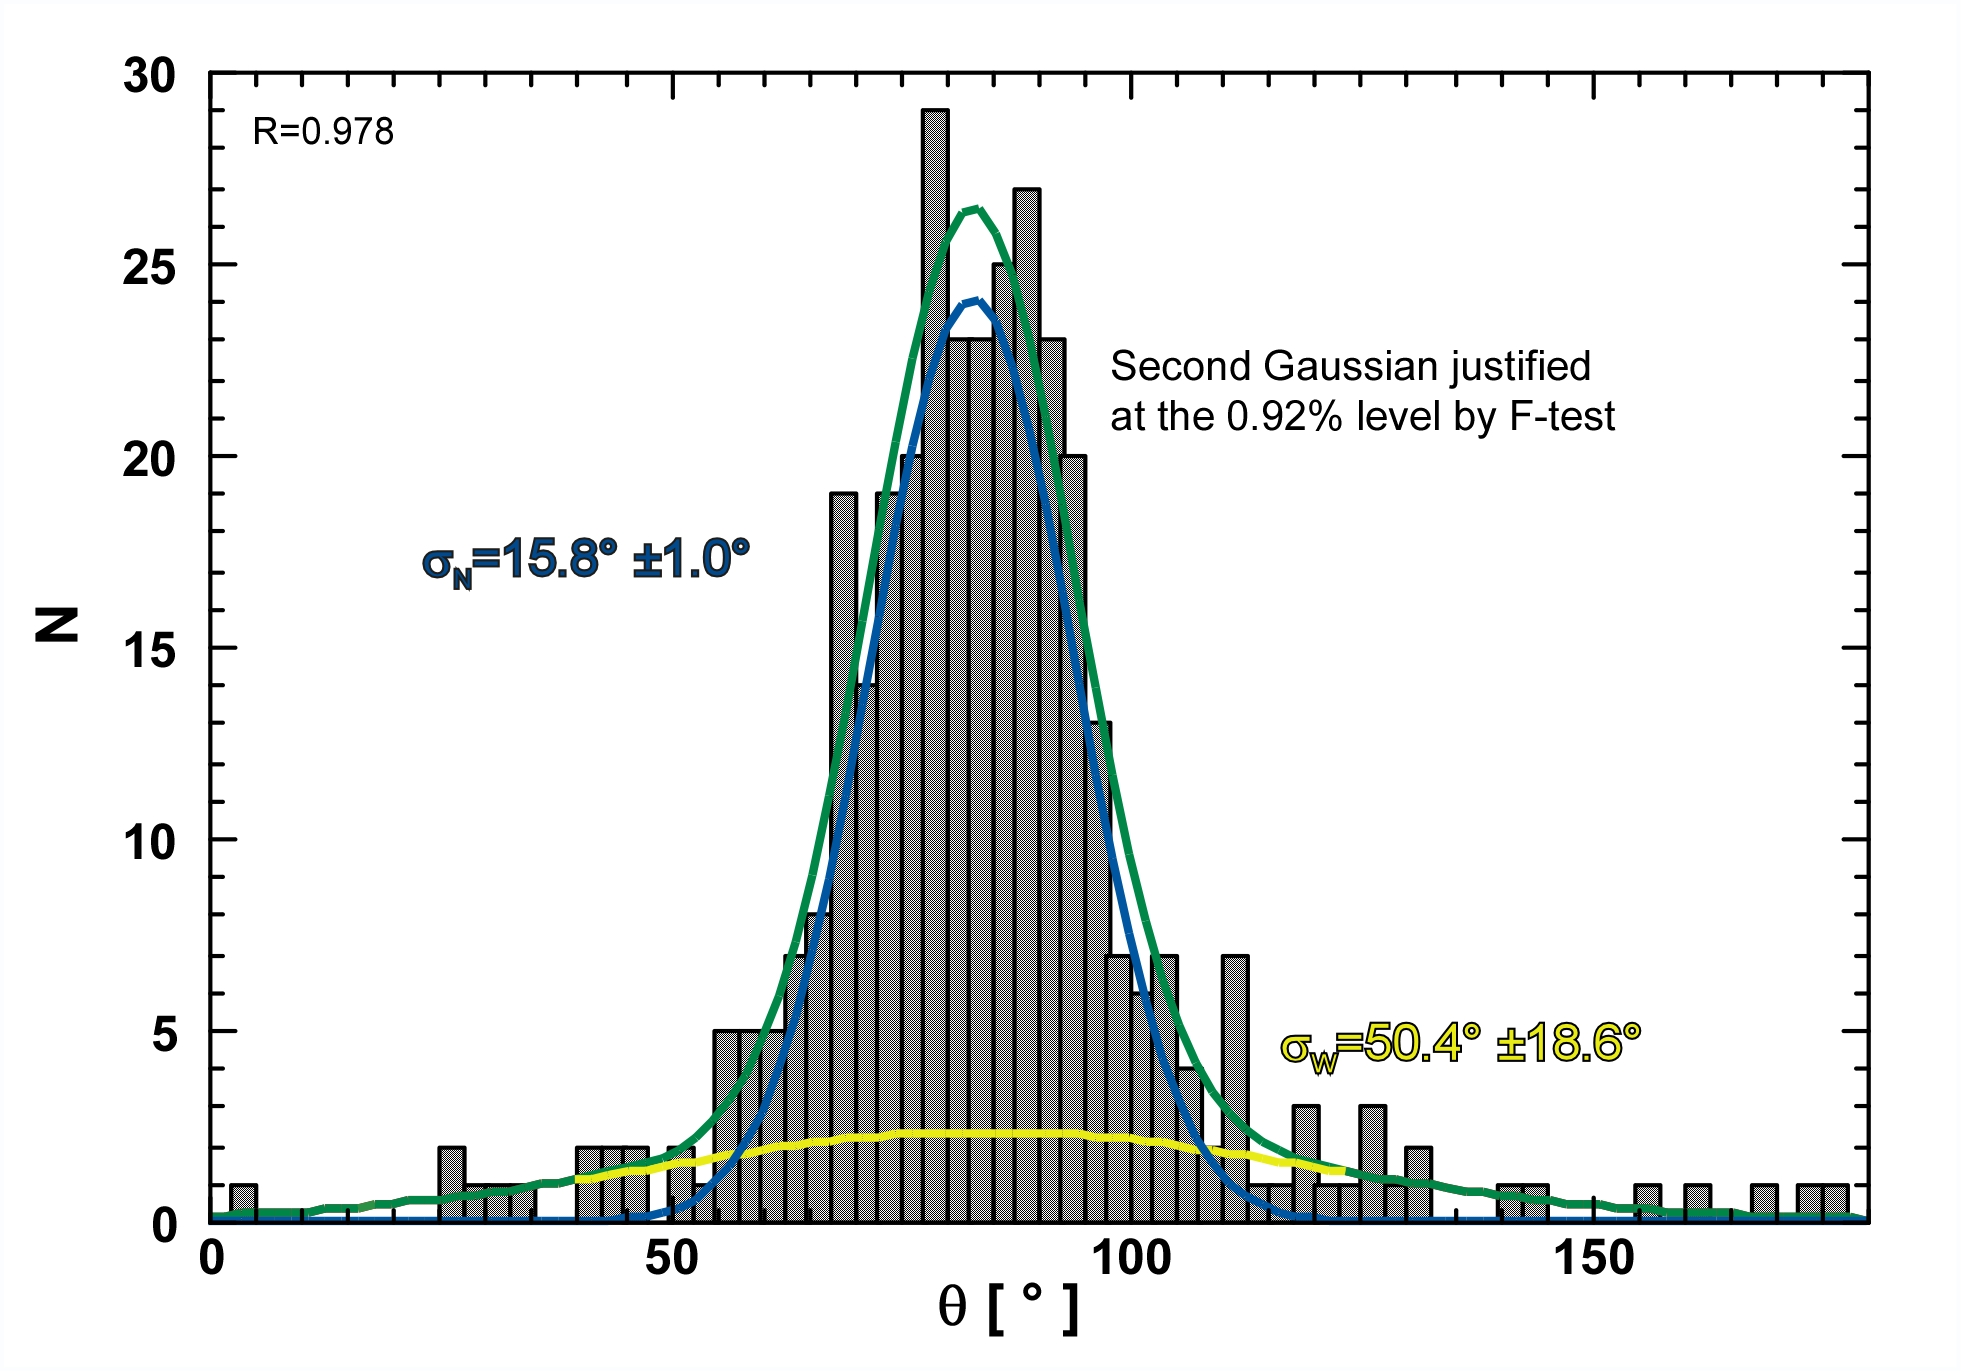
This is the paper discussing the discovery of a dependence of the grain alignment efficiency on the angle between the magnetic field and the illumination direction (Andersson & Potter 2010) and a follow-up paper confirming the effect and showing that the combination of multi-band [optical] polarimetry and far infrared data can be used to constrain the axis-ratio of the aligned dust grains (Andersson et al. 2011)
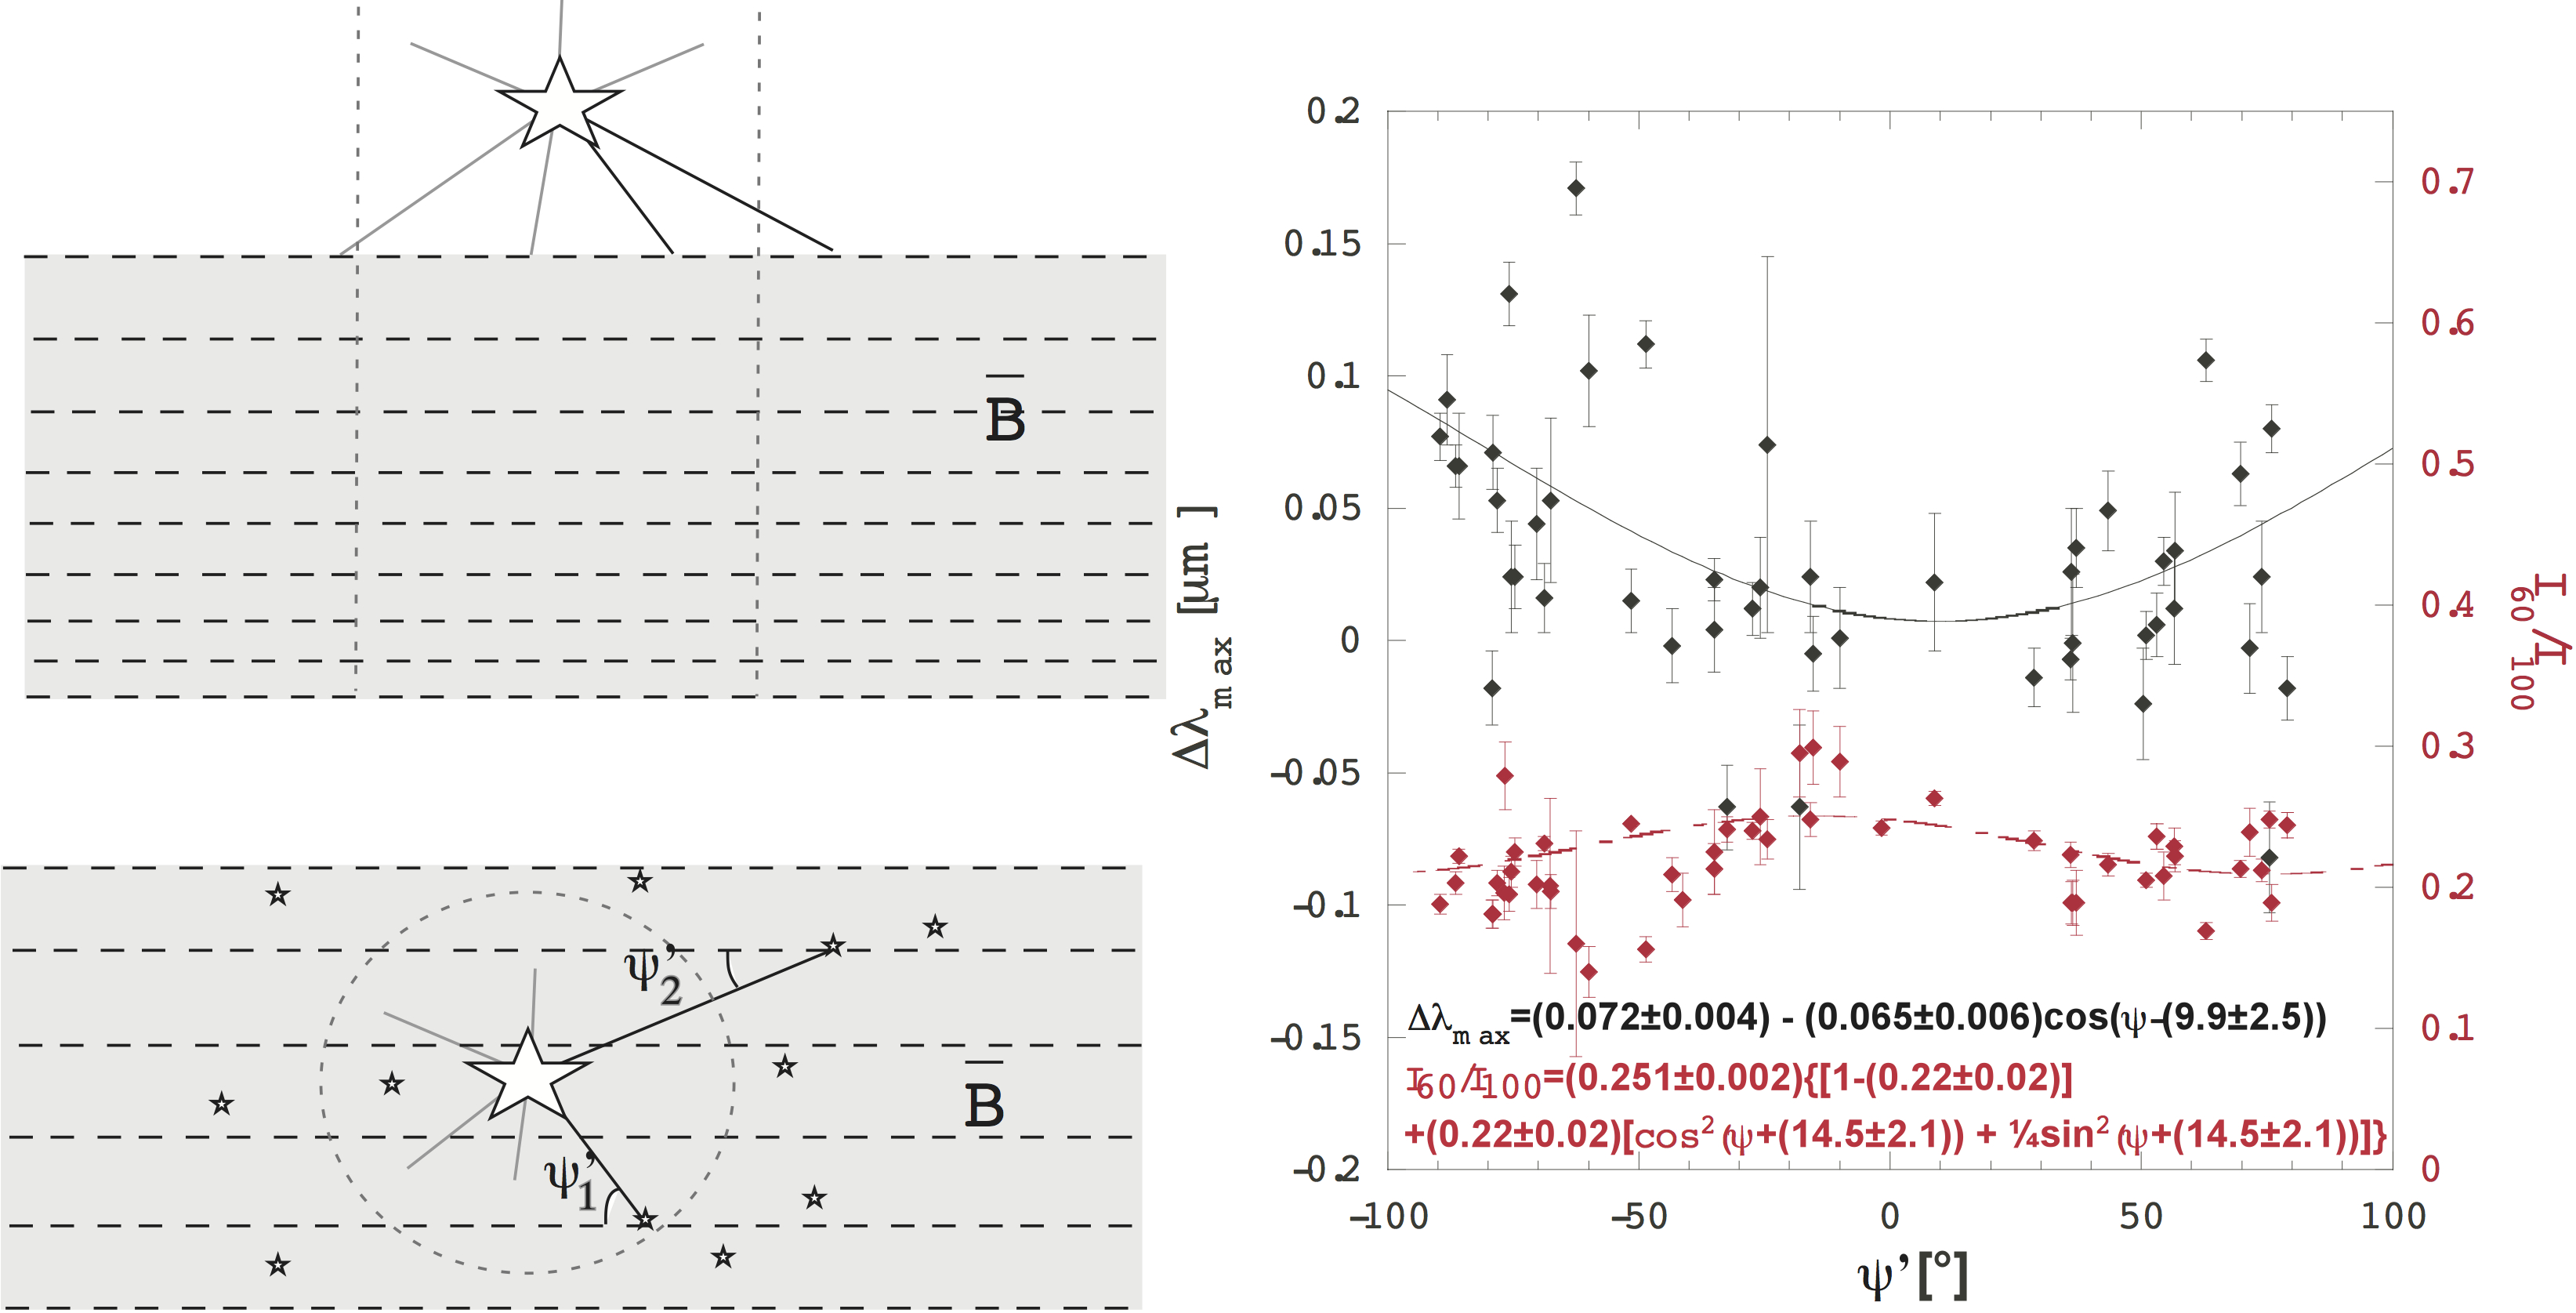
John Vaillancourt and I did the equivalent study using far infrared emission polarimetry towards the Becklin-Neugebauer object (and embedded protostar) in Orion and we find the equivalent angle dependence also in this source (Vaillancourt & Andersson, 2015).

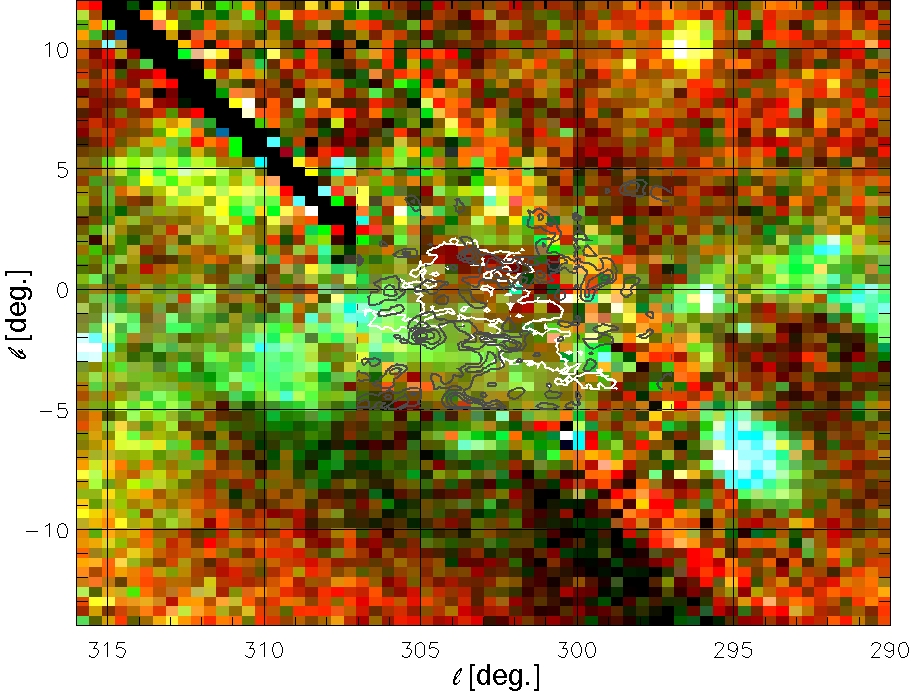
Here’s the paper Steve Potter and I wrote about the polarization towards the Southern Coalsack (Andersson & Potter 2005), arguing, based on a Davis-Chandrasekhar-Fermi analysis, that there is a very strong magnetic field associated with the cloud.
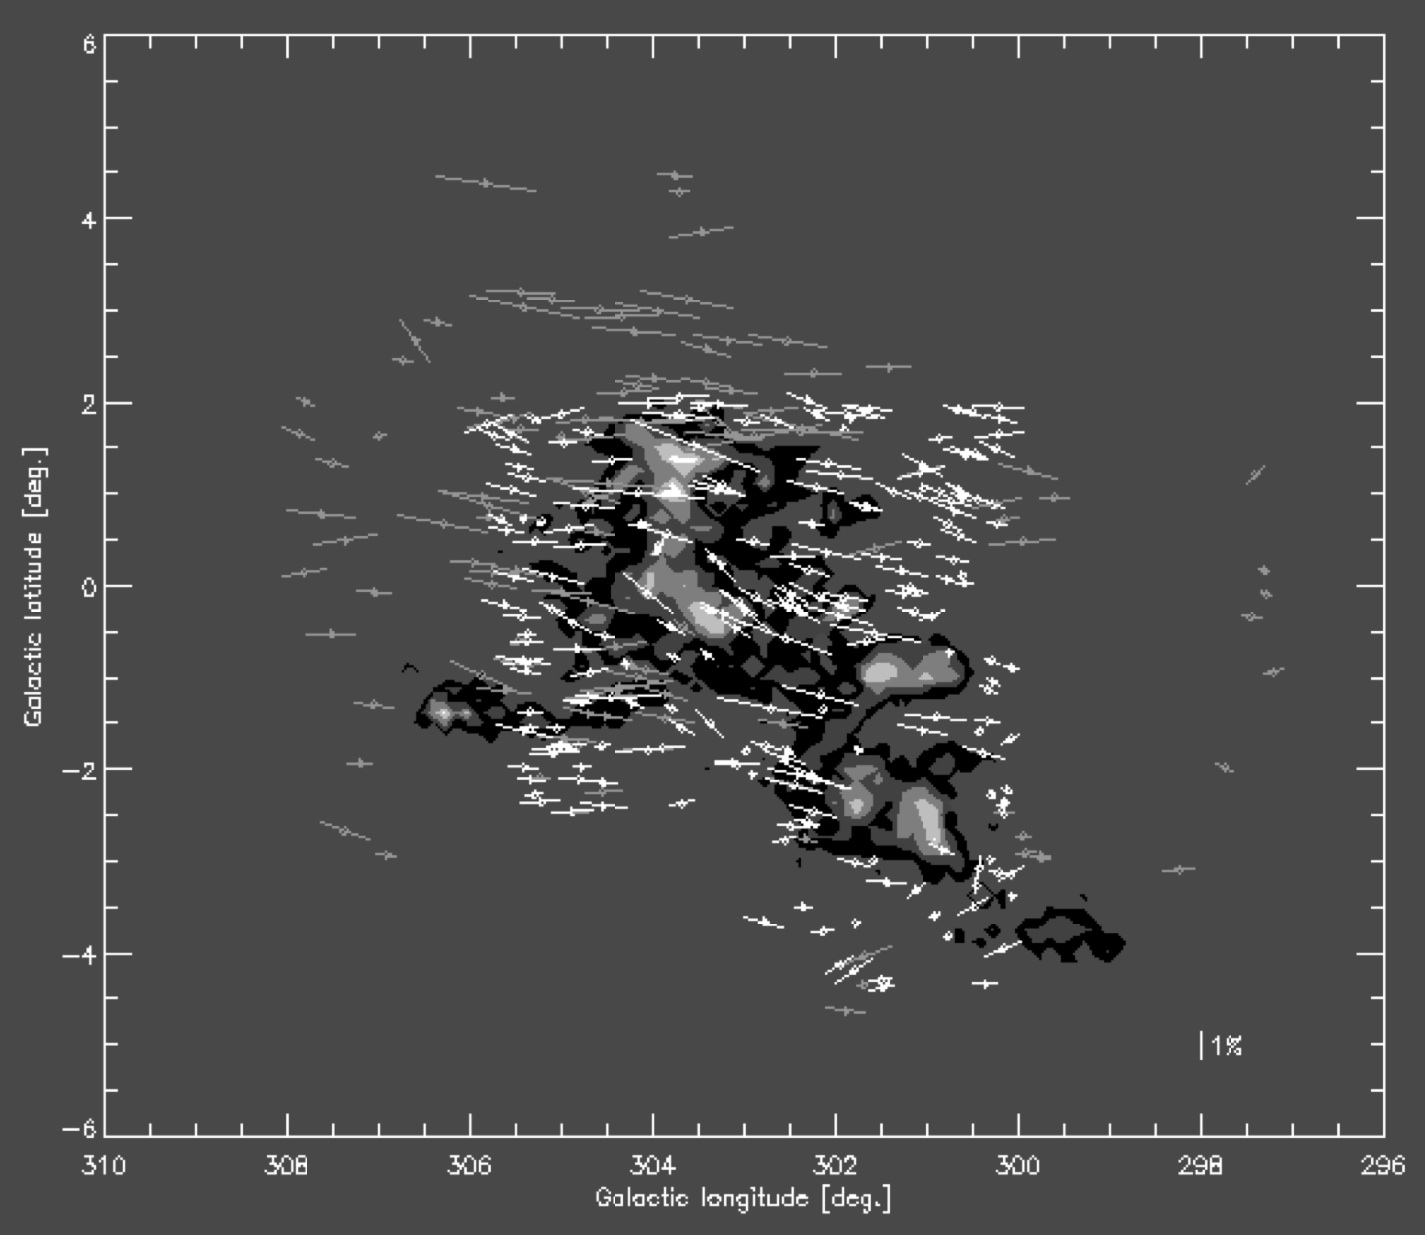
And this is the follow-on paper analyzing the polarimetry from the most near-by stars to show that the wall of the local bubble contains a magnetic field of ~8μG (Andersson & Potter 2006)
Based on FUSE, ultraviolet and ROSAT, X-ray data, we showed that the Southern Coalsack, is surrounded by a hot, x-ray emitting envelope (Andersson et al. 2004). This is likely due to the fact that the “Upper Centaurus-Lupus super bubble” overtook the cloud about 1 Myrs ago, compressing and heating the cloud envelope.
Ilija Medan and I have shown in a new (Jan 2019) paper that the fractional polarization, and therefor the alignment efficiency, is directly controlled by the intensity – and color – of the light impinging on, and aligning, the grains. We did this by probing the variations in the polarization caused by the dust in the wall of the “Local Bubble”.
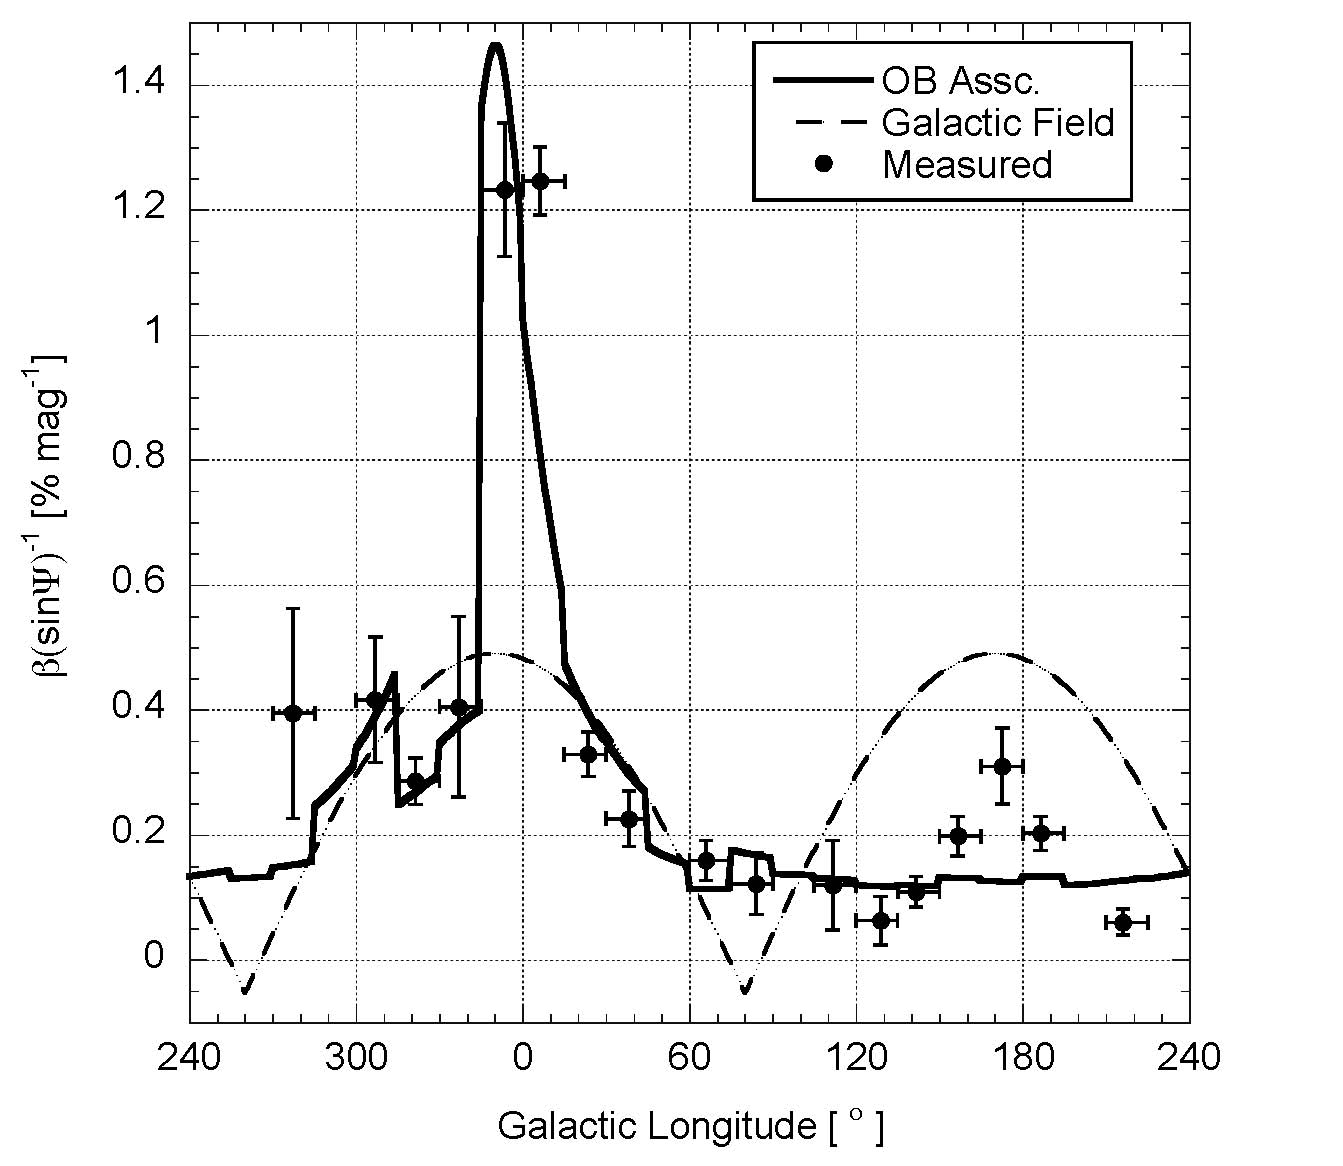
Using the Davis-Chandrasekhar-Fermi method, we were also able to show that the magnetic field strength varies around the wall of the Local Bubble in a way that can be understood by assuming that the wall is being compressed by the countervailing flows from inside the Local Bubble and from surrounding star groups.

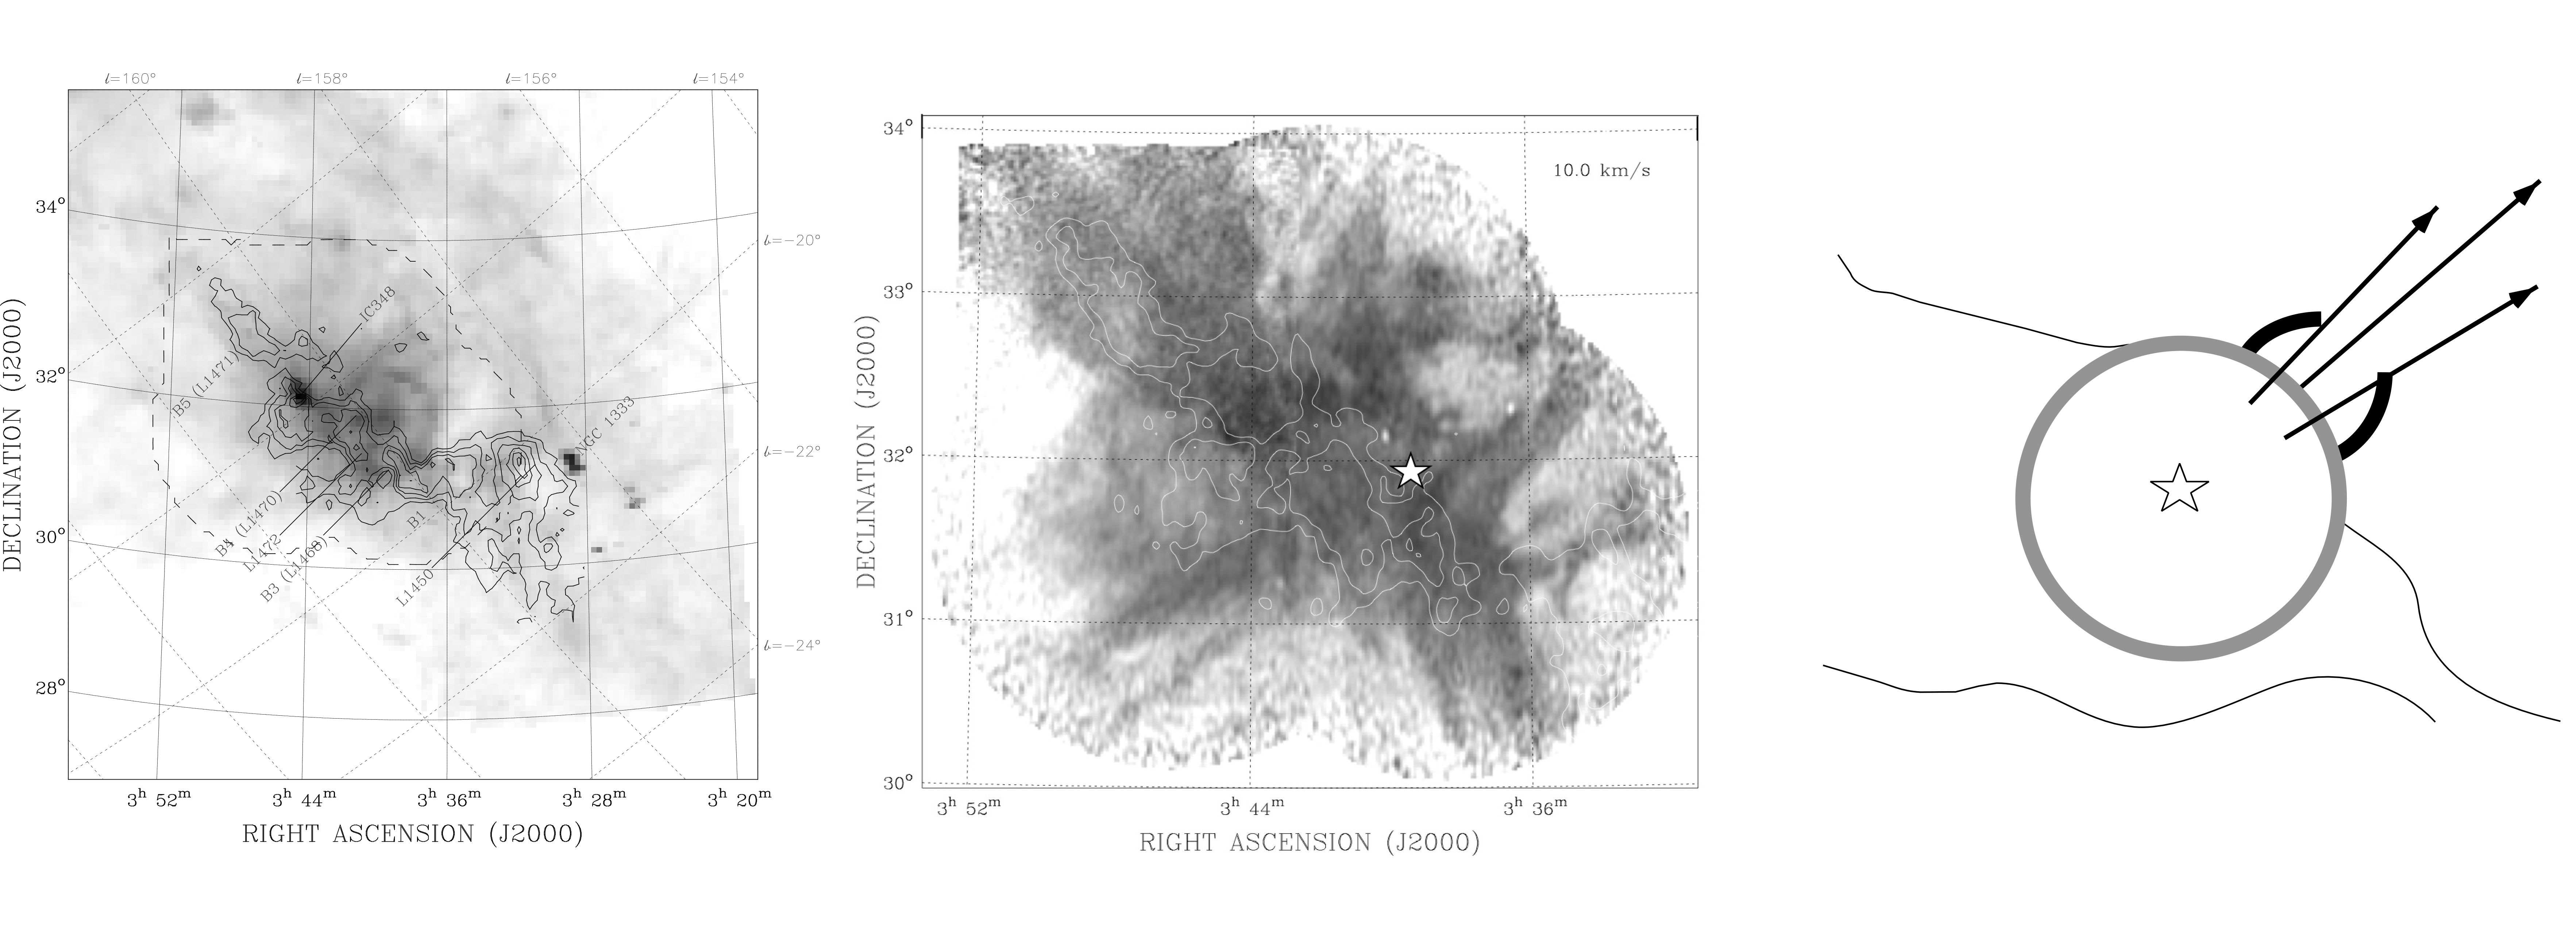
The original (note publication year!) description of the far-infrared ring in the Perseus cloud and the identification of the feature as being due to an embedded (but blow-out) H II region caused by the O9.5 – B0 V star HD 278942 (Andersson et al. 2000)
Another paper I’m rather fond of is this survey of Ultra-High Spectral Resolution optical spectroscopy of the CH radical in a number of near-by clouds (Andersson, Wannier & Crawford 2002)
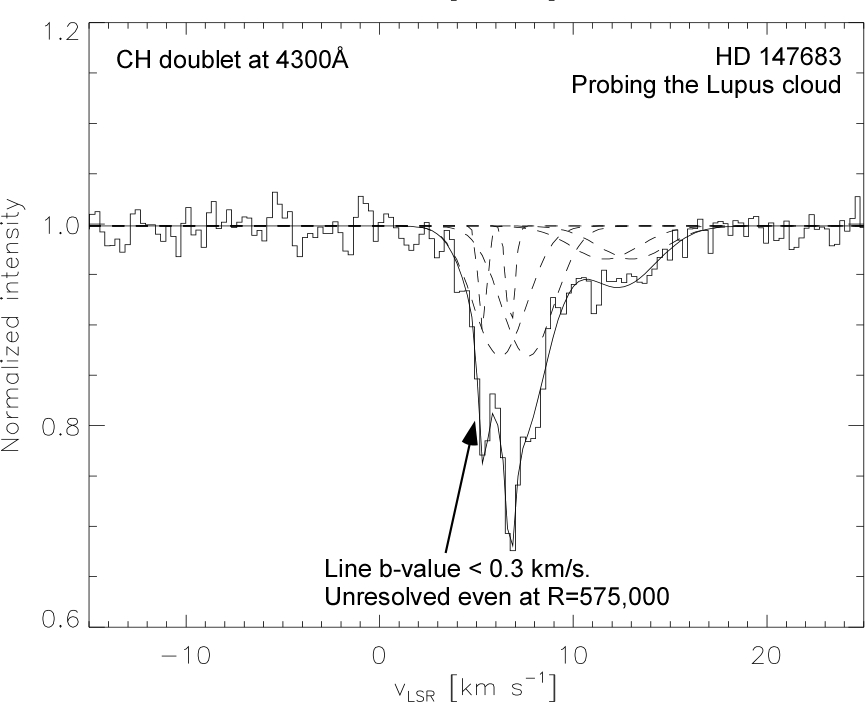
Having started out as a radio and mm-wave astronomer it took me a while to internalize that the velocity resolution that you “automatically” get from such observations (typically 0.5 km/s or better) is not “possible” in optical astronomy, where 5 km/s (resolving power R=60,000) is considered high spectral resolution.
One of my wishes is that some day (soon) we will have a spectrograph with R>300,000 on an optical telescope large enough to allow a dense enough sampling of background stars that we can directly compare the velocity structure and its variation across clouds in species we observe in the radio/mm-wave (e.g. CO, HCO+) with those we trace with optical telescopes (CH, CH+, K I, C2, etc.). The German PEPSI instrument on the Large Binocular Telescope might do that. Though, that’s a private observatory so if you’re not affiliated with one of the member universities it will be really hard to get time there.
In the works.
In a paper which is almost ready to submit, John Vaillancourt, myself and our collaborators use observations form the Kast prectrograph at Lick Observatory to show that the relationship between λmax and AV bifurcates at around the depth into the cloud where ices form. We interpret this as being due to grain growth in those lines of sight that probe denser clumps of gas (on the “upper branch”).
Using CARMA mm-wave observations of HCO+ we have been able to show that the randomization of the grain alignment (in neutral gas – at least) is indeed dominated by collisions with the gas and depend both on gas density and gas temperature, as expected

Popular
I published an article in the Australian edition of Sky & Telescope (2012, Vol 63, p38) on:
“The Southern Coalsack – The Coolest Hot Cloud on the Southern Sky”,
but unfortunately it’s not available in electronic form. A non-typeset manuscript version is here’s.
Selected Presentations
Invited talk: “Interstellar Grain Alignment Observations” given at “Magnetic Fields in the Universe IV” , Playa del Carmen, Mexico, 4-8 Feb 2013
I gave a talk about
“Interstellar Grain Alignment – An Observational Perspective”
at the conference
“Star Formation, Magnetic Fields, and Diffuse Matter in the Galaxy: A Conference Honoring the Contributions of Richard Crutcher & Carl Heiles”, held May 23-26, 2016, in Madison, WI.
The talk was recorded and posted to YouTube by the organizers (link through the title).
(I note that, after having had a Schwannoma growing on my vagus nerve taken out in 2011, my left vocal chord is paralyzed. This is why I sound a bit like I have a combination of asthma and bad laryngitis)
I was part of a news briefing on Jan 9 2018, at the AAS meeting in Washington D.C., about the SOFIA/HAWC+ results presented at the meeting.
My research assistant, Ilija Medan, and I were presenting a poster showing how the light from the near-by OB associations (primarily the Upper Scorpio and Upper Centaurus-Lupus ones) strongly affect the grain alignment efficiency in the wall of the local bubble.
I also had a talk showing that the carbon grains in the envelope of IRC+10216 are aligned radially. This can [only] be understood because carbon grains are diamagnetic, but in the strong, highly anisotropic radiations field around the stars, the alignment direction becomes that of the radiation field flow (“k-vector”)
(will post slides “shortly”…)
Dr. Bob Frey took this picture of me at the briefing (Thanks!)